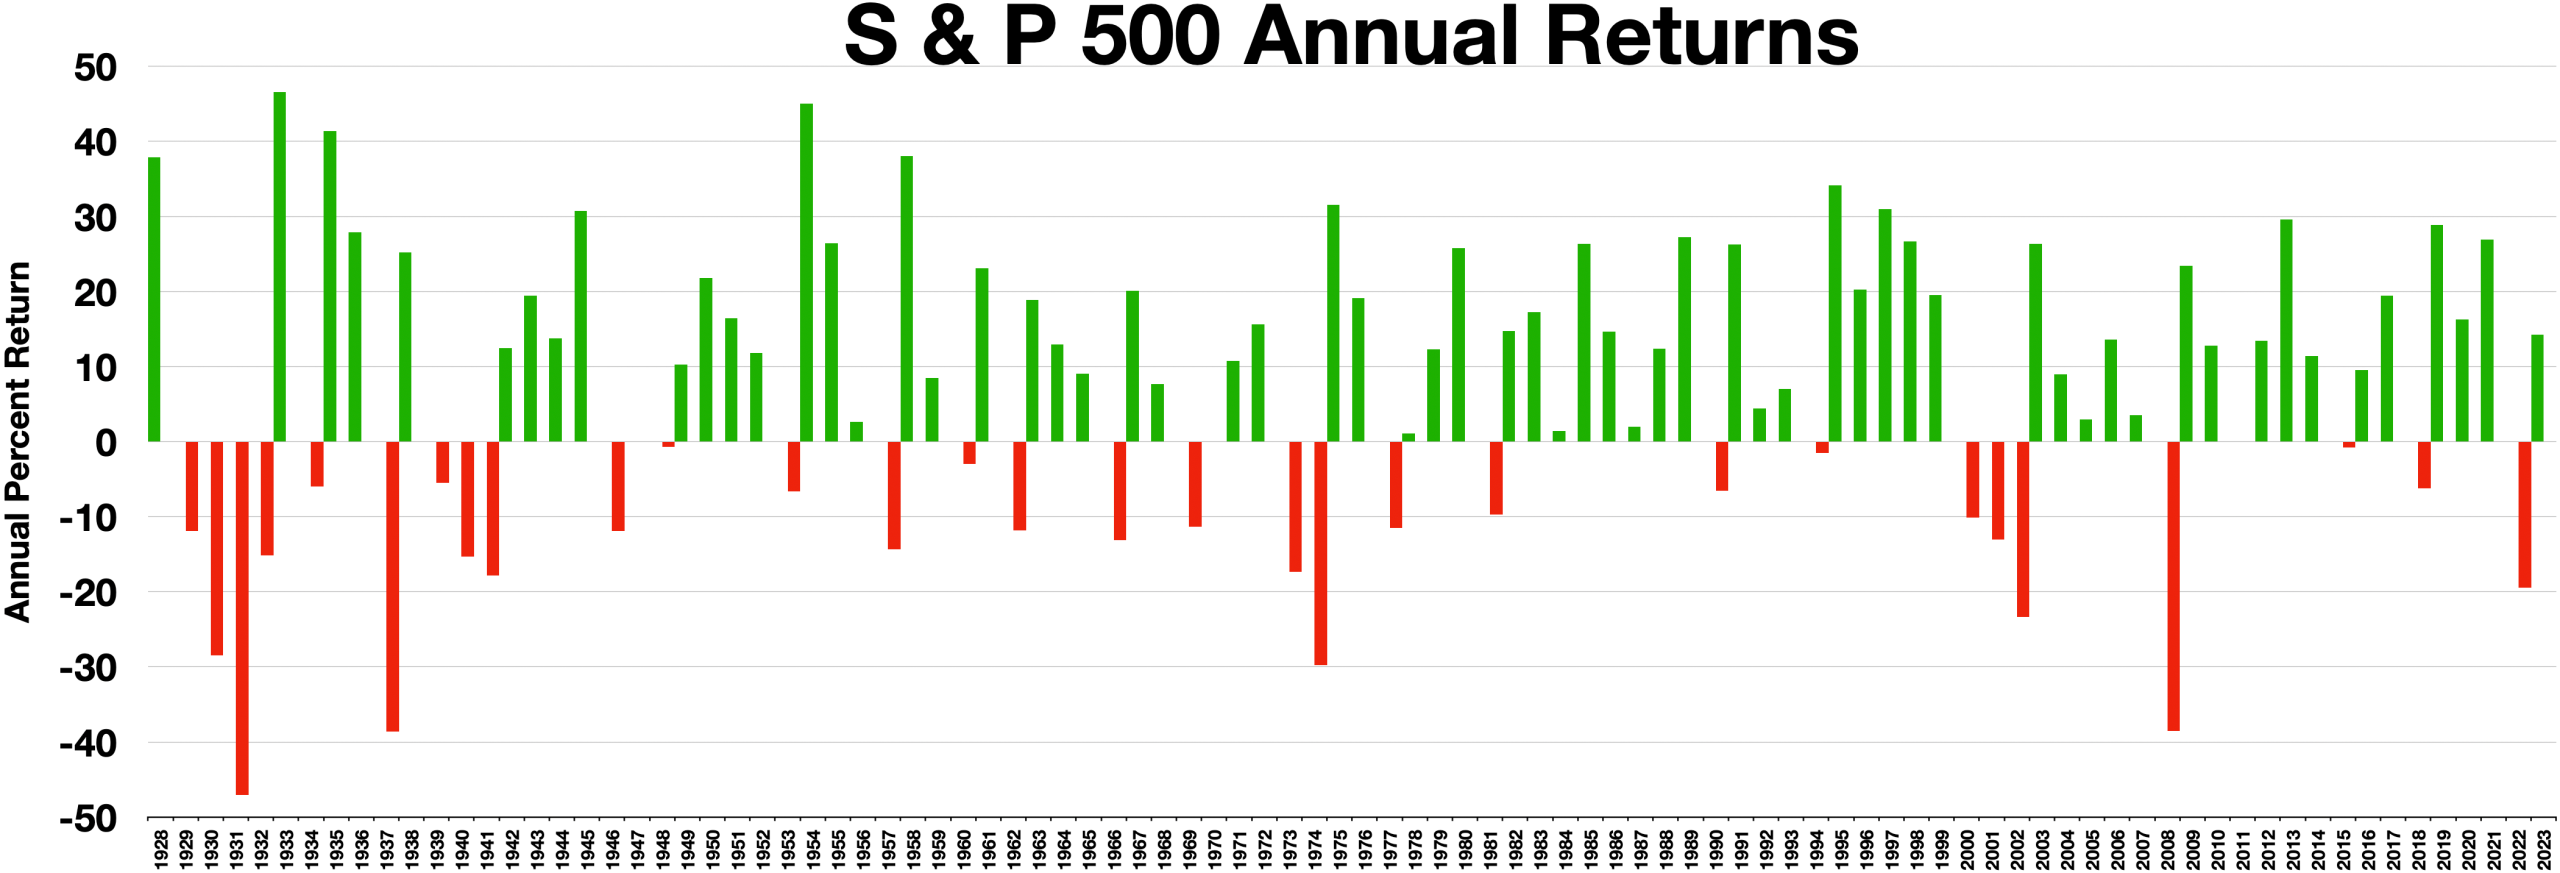
A sharp market selloff has rattled investors, yet the benchmark index remains well ahead of its usual midterm-election-year pace. The bigger question is whether a familiar post-election pattern can outweigh the risks investors still face.
The stock market is performing better than it typically does during a U.S. midterm election year, even after recent market declines and extraordinary volatility. As of Aug. 22, 2026, the S&P 500 was up 11.6% for the year through Aug. 20, compared with a 1.3% loss at the equivalent point in the average midterm year from 1954 through 2022, according to MarketWatch.
That gap is the surprisingly good news for investors: the historical pattern of postmidterm strength has often been favorable, and the index could fall roughly 11% and still be no worse than the typical midterm-year position cited in the analysis. It is a useful perspective after a rout that made the market’s short-term fragility impossible to miss.
A selloff changed the mood
Market declines have a way of making longer-term numbers feel irrelevant. When prices fall quickly, investors tend to focus on the immediate damage, the next opening bell and the possibility that a temporary drop will become something more serious.

MarketWatch’s comparison puts that reaction in context. Its analysis says the S&P 500 remained far ahead of the level associated with an average midterm election year, even after the Aug. 20 selloff.
That does not minimize the volatility. A gain earlier in the year does not protect an investor who bought near a recent high, and an index-level return says little about every individual stock, sector or portfolio. It does show that the market’s broader position was stronger than the day-to-day anxiety suggested.
The key comparison is historical
The 11.6% figure is a year-to-date, price-only gain for the S&P 500 through Aug. 20. MarketWatch compared it with the average performance through the same stage of midterm election years between 1954 and 2022, when the index had posted a 1.3% loss.
Price-only matters. It measures changes in index prices and does not include dividends, so it is not the same as an investor’s total return. Still, using the same measure on both sides of the comparison gives a direct view of how this year stacks up against that historical yardstick.
The approximately 12.9-percentage-point spread is not a promise about where stocks go next. It is evidence that this midterm year has not followed the more difficult early-year pattern that the historical average suggests.
- Current comparison: S&P 500 up 11.6% year to date through Aug. 20.
- Historical benchmark: average 1.3% decline by the equivalent point in midterm years from 1954 through 2022.
- Practical cushion cited: a decline of about 11% would still leave the market no worse than that historical midterm-year position.
Why midterms draw attention
Midterm elections are often treated as a test of the governing party and can reshape the political environment in Washington. For markets, the issue is less the campaign calendar itself than the uncertainty around policy, taxes, regulation, spending and the balance of power after votes are counted.
That uncertainty can create a neat story for investors: stocks struggle ahead of an election, uncertainty clears, and a rally follows. The historical postmidterm strength highlighted by MarketWatch is consistent with that narrative.
But a narrative is not a trading rule. The market does not move because a calendar page turns. Corporate earnings, interest rates, inflation, economic growth, geopolitical events and investor positioning can all matter at least as much, and sometimes much more, than an election cycle.
Postmidterm strength is not destiny
The phrase “historical pattern” deserves careful handling. A pattern drawn from past midterm periods can describe what happened across a long sample; it cannot establish that the election cycle caused each result or guarantee the next one.
The 1954-to-2022 window contains very different economic eras, including recessions, inflation shocks, credit crises, wars and major shifts in monetary policy. Averaging those years creates a useful benchmark, but it also smooths over the conditions that made each period distinct.
There is a fair bullish interpretation: stocks have already held up better than their usual midterm-year record, and history suggests the period after a midterm election has often been constructive. The skeptical interpretation is equally important: an above-average start may leave valuations and expectations more exposed if the economic or policy backdrop worsens.
Neither view can be settled by one statistic. The 11.6% gain is a snapshot, not a finish line.
Investors should separate signal from noise
The more practical lesson is about scale. A dramatic down day can be real and painful without erasing the market’s broader advance. Looking at a comparable historical point helps distinguish a sharp pullback from a claim that the entire year has been unusually weak.
It also argues against treating election-season headlines as a reason to abandon a plan. Investors with diversified, long-term strategies may find the historical comparison reassuring; investors with near-term cash needs or concentrated holdings may face risks that an S&P 500 average cannot capture.
Those are different situations, and the same election statistic will not answer both. A broad index can be higher while particular industries or portfolios are under pressure.
The next test is durability
What remains unclear is whether the S&P 500 can preserve its lead over the typical midterm-year path as volatility continues. The historical postmidterm pattern offers context, not certainty, especially when markets are reacting sharply to current developments.
For now, the central fact is straightforward: despite recent declines, the stock market has been substantially stronger than the average U.S. midterm-election-year record at this point. That is genuinely encouraging for investors who feared the latest selloff had already put the year on a historically poor track.
The disciplined takeaway is narrower than a prediction. Election-year history can help frame a turbulent market, but it should sit alongside the risks, time horizon and objectives that determine whether any market move actually matters to an individual investor.
Leave a Reply